CMA Dashboard Flyover
March 8, 2025
CMAsnap Dashboard Page Flyover
Quickly show your client what their home is worth
Table of Contents
- Exploring the CMA Dashboard
- See Nearby Listings
- Selecting Comps
- Watch Pricing Recommendations Adjust Automatically
- Use Active, Pending and Sold Listings Strategically
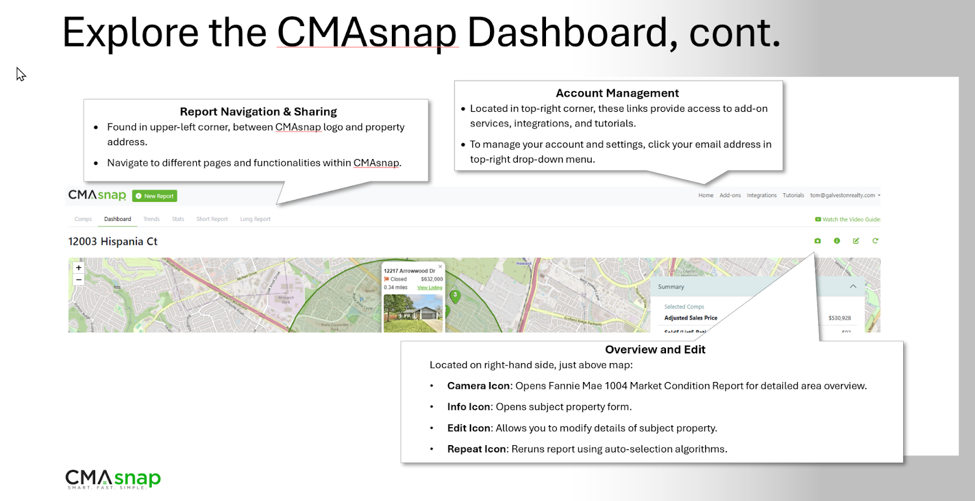
Exploring the CMA Dashboard
The first step is it to create a new report. This is where you build your CMA story—one comp at a time. The CMAsnap Dashboard is located inside each report.
This is your interactive workspace for evaluating nearby properties and choosing the ones that best support your client’s pricing strategy. From sold homes to active listings and pending sales, the tool shows you what’s happening around the subject property—and how each selection shapes your report.
Here’s a quick flyover of how it works.
Once you’ve entered your subject property, you will be taken to the Dashboard. This isn’t the final client-facing report—it’s the behind-the-scenes view where you actively build it.
Think of it as your CMA control center.
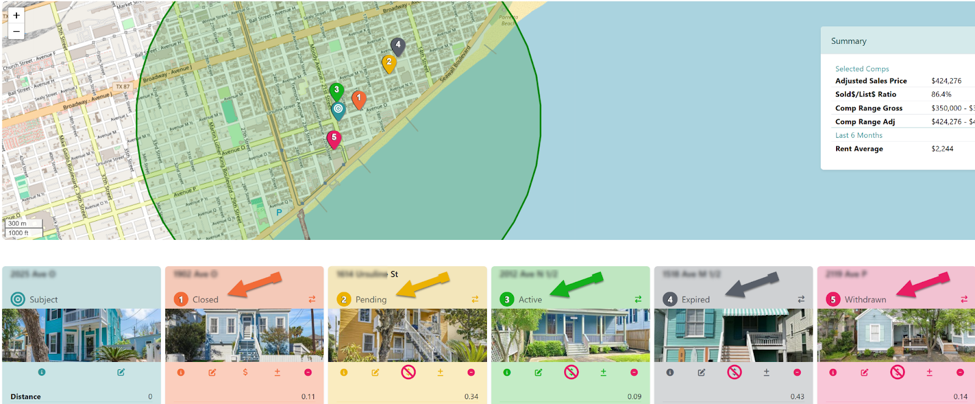
What You’ll See: Nearby Listings by Status
At the core of the Report Page tab is a list of nearby homes, automatically pulled based on proximity to your subject property. These include:
-
Subject Property (in blue)
-
Sold homes (in orange)
-
Pending sales (in yellow)
-
Active listings (in green)
-
Expired listings (in grey)
-
Withdrawn listings (in red)
Each property includes a quick snapshot—photo, price, square footage, days on market, and more—so you can evaluate it at a glance. Just click the pin to see it.
Tip: Use this view to explore the full landscape before making any selections.
Selecting Comps: Click to Include, Refine or Deselect
Every property shown is a potential comp. You can:
-
Click to include or exclude any home as a comp
-
See your selections update in real time at the bottom of the screen
-
Quickly test different combinations to see how they affect your pricing visuals and metrics
There’s no commitment—you’re free to experiment and refine.
Right under the photo of each real estate comp, you see 5 icons. Clicking these provides a variety of options to customize your competitive market analysis (CMA).
Comp Controls
Listing Info
View information directly imported from the MLS or tax record
Used in Price
- Dollar sign visible? Comp is included in the pricing calculation - Click the Dollar Sign to exclude it from calc.
Adjustments
Use the Plus/Minus sign to open the adjustment mode - review existing adjustments - make changes or add new adjustments - save changes as needed
Edit Listing:
Modify any available fields
Remove comp from report
Not Included in Price
Tip: Want to know how pricing looks if you leave out a fixer-upper? Just uncheck it and see the updated summary instantly.
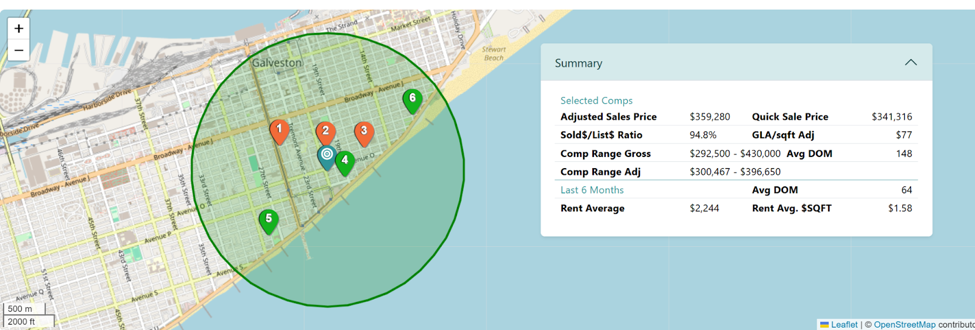
Watch the Pricing Recommendations Adjust Automatically
This includes:
-
Recommended price or price range
-
Price per square foot ranges
-
Averages and medians
-
Market positioning based on statuses
No need to recalculate or rebuild anything manually—CMAsnap does it for you.
Use Active, Pending, and Sold Listings Strategically
Each listing status tells part of the pricing story:
-
Sold homes show where the market has been
-
Pending homes reveal current demand
-
Active listings define the competition
By selecting a smart mix of all three, you can position your client’s home with data-backed confidence.
Tip: And if a client challenges your recommendation? You’ve got the comps right there to show them why.
Next Step: Finalize in the Report Page Tool
Once you’re happy with your comp selection, you can move into the final Short or Long Report Page tool to personalize, polish, and share your CMA.
Final Thoughts
This view inside the Dashboard isn’t just for building reports—it’s where agents do their real pricing work. Whether you’re fine-tuning comps or testing different scenarios, the Report Page tab gives you flexibility, clarity, and control.
Tip: Your CMA isn’t just data. It’s a story—and it starts right here.